Rainfall Records for Great Bradley
The British are often accused of being obsessed about the weather. With good reason, as its many variations impact on so many aspects of our life. Few feel its effects more than farmers and, therefore, my father started to measure the rainfall here in 1954. Since then the rain has been meticulously measured every day. The site at The Hall is an official one, and we send statistics at the end of each month to The Environment Agency/Met Office.
At the end of the 1990s all the historical data was put on computer and began to produce a series of graphs that make it easier to analyse the results.
At the end of the 1990s all the historical data was put on computer and began to produce a series of graphs that make it easier to analyse the results.
2015 RAINFALL REPORT
Despite a somewhat ‘colder snap’ as I write, this had been another mild, somewhat wet winter. We started picking daffodils on the 28th December!
In overall terms, 2015 rainfall was a little below the average: -
- 2015 Rainfall: 662.70mm (24.51ins)
- 10 Year Rolling Average: 667.76mm (26.29ins)
- 50 Year Rolling Average: 636.27mm (25.05ins)
Please see graphs below
In overall terms, 2015 rainfall was a little below the average: -
- 2015 Rainfall: 662.70mm (24.51ins)
- 10 Year Rolling Average: 667.76mm (26.29ins)
- 50 Year Rolling Average: 636.27mm (25.05ins)
Please see graphs below
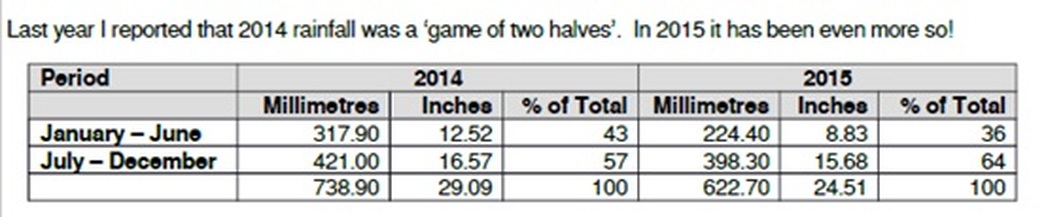
For some years it has been evident that the period July to November was generally becoming wetter and the last
two years seem to validate this trend. This is important, and not necessarily good news, as it is the key
operational period of the farming year, covering both the harvest in the high summer and the cultivation/drilling
period in the early autumn.
Given this trend, I thought it would be interesting to look at the first half/second half split since we began
recording rainfall for the Met Office in 1954.
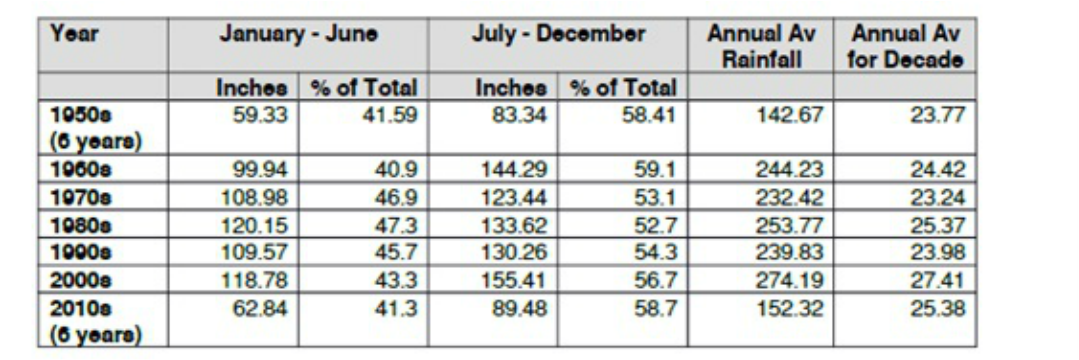
So it seems that following the 2000s, the wettest period (with an annual average of 27.40ins) since our records began, two trends have become apparent in this current decade. First, a reversion to a more long term average, somewhat lower level of rainfall (25.40ins per year to date in this decade in line with the 50 year average of 25.05ins). Secondly, we are indeed seeing a greater proportion of rainfall in the second half of the year than in any decade since the 1960s.
However, as it happens, this is not necessarily bad news as the average amount of annual rainfall in this decade is down to around 25ins, or lower as in 2015; the larger proportion in the second half is a ‘containable’ amount. Indeed, we now seem to be copying the 1960s in terms of total rainfall – the average annual rainfall for the 1960s was 24.40ins, almost exactly the same as the rainfall in 2015. So is it back to the ‘Swinging 60s’!? Let’s hope so because, as the graphs show, those years were far more consistent, and less extreme, than more recent decades in rainfall terms– halcyon days, with benign weather suiting farmers and gardeners alike! And good for music too!
We shall see whether my optimism about the weather holds good in 2016!
Technical details of the Weather Station
Name: GREAT BRADLEY HALL (Locate on Googlemap )
src_id: 5049
Geographic area: SUFFOLK
Latitude (decimal degrees): 52.15
Longitude (decimal degrees): 0.447
Grid ref: TL 673530
Grid ref type: OS
Postcode: CB8 9
Elevation: 85 meters
Drainage stream: STOUR
Hydrological area ID: 360
Station start date 01-01-1967
Station end date Current
Measurements made
- CARLOS (Monthly & annual climatological averages, calculated by NCIC) from 01-01-1967 to Current
- CLMSN (Monthly & annual climatological averages, & check values for sfc CLIMAT messages) from 01-01-1961 to 31-12-1990
- WADRAIN (Water Authority Daily rainfall values) from 01-01-1967 to Current
Click here for more information on these terms
2010 RAINFALL REPORT
In 2000, it was the previous 46 years. I wrote that, “little is changing climatically, although the 1980s did produce a somewhat wetter trend, with a rise in the ten year rolling average from 23ins per year in 1980 to 26ins in 1988. Since then, we have reverted to a normal pattern.” and “rainfall amounts continue to be similar on average, although in the last 10 years patterns have been more extreme, like the 1950s”
Since 2000, however, a discernible trend has developed. Before looking at that, here are a few interesting highlights of rainfall patterns since 1954
What is the discernible trend to which I referred? I think that it can be seen from the two graphs set out below.
Table 1 is the 10 Year Moving Average.
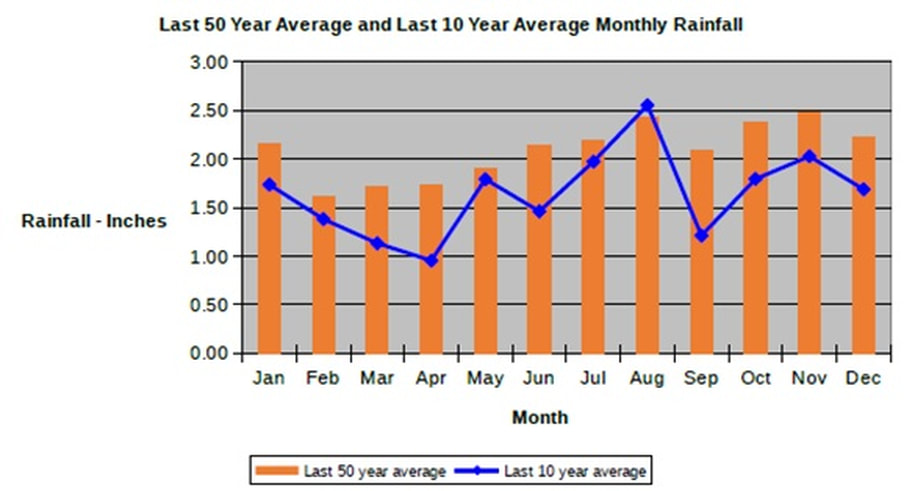
Table 2 is the Average Rainfall by Month, showing both the 50 and 10 Year Rolling Averages.
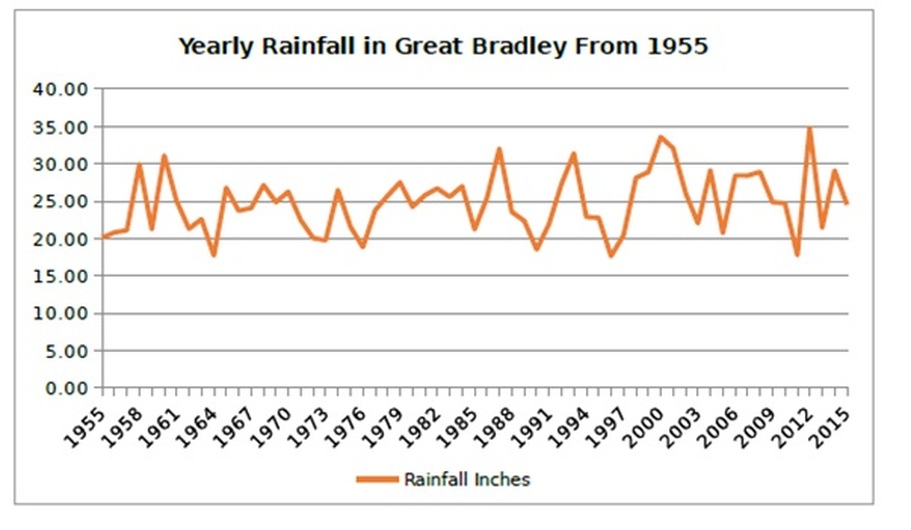
You will see from Table 1 that the 10 year rolling average was approximately 23ins per annum in 1964 and this average broadly continued until 1982. Since then rainfall has been far more erratic and, apart from a reduction in the late 1990s, it has been trending in an upward direction, but only significantly so since about 2000. The 10 year rolling average as at the end of 2006 had reached all but 27ins, a big jump compared to the 23 – 24ins average which prevailed for so long. From Table 2 you will see that this increased rainfall has come almost entirely in the period August to November. As arable farmers, this is precisely the time when we do not want more rain! August is the key month for the harvest and September/October are the key months for drilling next year’s crops.
Since 2000, however, a discernible trend has developed. Before looking at that, here are a few interesting highlights of rainfall patterns since 1954
- The current 10 year rolling average is 26.94 ins per annum compared to a 50 year average of 24.54 ins. In short, it has, on average, been 2.5ins wetter each year over the last 10 years compared to the last 50 years.
- There have been 5 years with rainfall of over 30 ins – 1960, 1987, 1993, 2000 and 2001. The wettest year was 2000 with 33.58in
- The wettest months are now August and October, with the whole period of August – November being particularly wet; not so good from a farming perspective.
- There have been 5 years of rainfall below 20 ins – 1964,1973, 1976, 1990 and 1996, (2005 was just over at 20.32ins). The driest year was 1996 with 17.65ins.
- The driest month is February, indeed February to May is now the driest period of the year.
What is the discernible trend to which I referred? I think that it can be seen from the two graphs set out below.
Table 1 is the 10 Year Moving Average.
Table 2 is the Average Rainfall by Month, showing both the 50 and 10 Year Rolling Averages.
You will see from Table 1 that the 10 year rolling average was approximately 23ins per annum in 1964 and this average broadly continued until 1982. Since then rainfall has been far more erratic and, apart from a reduction in the late 1990s, it has been trending in an upward direction, but only significantly so since about 2000. The 10 year rolling average as at the end of 2006 had reached all but 27ins, a big jump compared to the 23 – 24ins average which prevailed for so long. From Table 2 you will see that this increased rainfall has come almost entirely in the period August to November. As arable farmers, this is precisely the time when we do not want more rain! August is the key month for the harvest and September/October are the key months for drilling next year’s crops.
